
Demographic changes are reshaping economies and societies across Asia and the Pacific
Population dynamics in Asia and the Pacific are changing rapidly and unevenly. Countries and areas across the region are experiencing shifts in fertility, mortality, migration, population growth, spatial distribution and age structure. These trends have important implications for sustainable development, social inclusion, labour markets, urbanization, health, education and social protection.
To support member States, ESCAP brings together key population and development indicators and presents them through data visualizations, country profiles and comparative tools. These resources are intended to support evidence-based analysis, forward-looking planning and informed policymaking across the region.

Population Data Sheet
The Population Data Sheet, published annually by ESCAP, features a range of key indicators on population and development. The focus is on the demographic components of population change (fertility, mortality and migration), population size, structure and growth rates, at country, subregional and regional levels. The Data Sheet is a useful reference tool for researchers, policymakers and other stakeholders.

Key Statistics
Key insights into key population indicators for countries in Asia and the Pacific
Population data insights
While the population in Asia and the Pacific continues to grow, the overall growth rate is declining
Figure 1. Population size, by Asia-Pacific subregion, and annual growth rate for Asia and the Pacific, 1950–2050
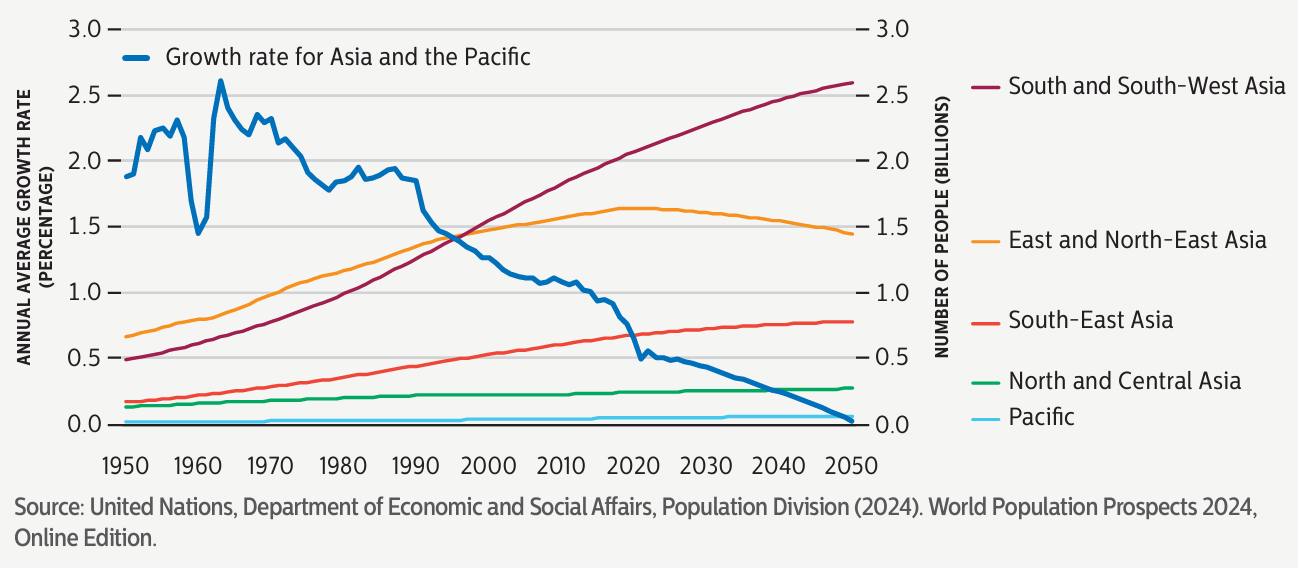
The population in Asia and the Pacific continues to grow, but at a declining rate. In 2024, there were 4.8 billion people living in the region, representing about 60 per cent of the total global population. Projections for 2050 indicate a rise to 5.2 billion people. Subregional trends reveal diverse dynamics: substantial growth in South and South-West Asia, stagnation and decline in East and North-East Asia, moderate growth in South-East Asia and North and Central Asia, and steady, low growth in the Pacific. Population stagnation and decline pose challenges and opportunities for countries which should be addressed from a people-centered and human rights perspective.
The population of most countries in Asia and the Pacific will likely peak within this century
Figure 2. Countries and areas in Asia and the Pacific by period of population peak, 1950-2100
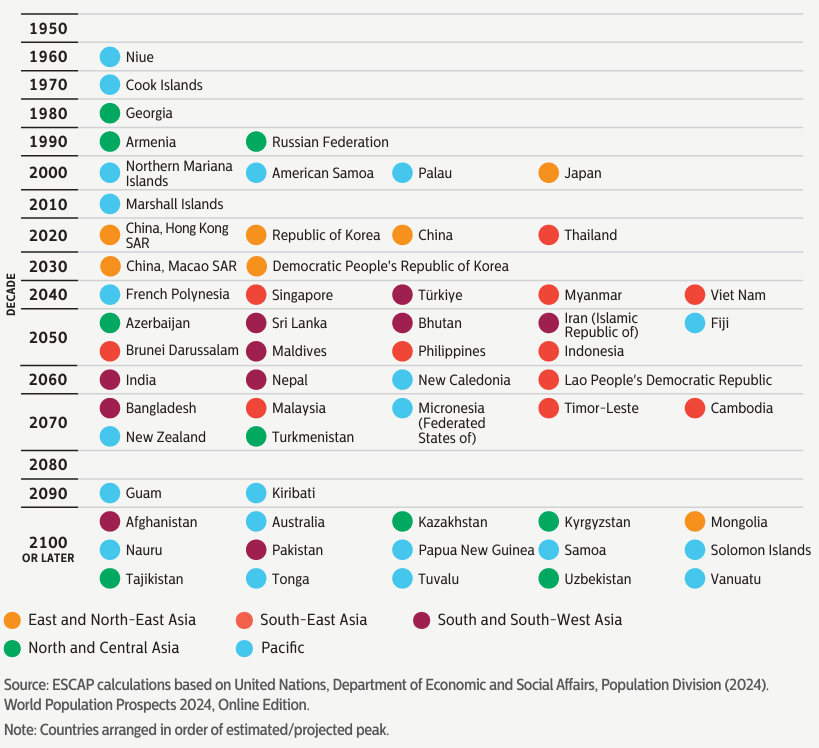
The demographic trajectories are diverse across Asia and the Pacific, with the timing of population peaks varying significantly between countries and subregions. However, for the majority of countries in the region, populations will peak within this century. While some countries have already reached their population peak, others are projected to do so later this century, with some reaching their peak in 2100 or later. The timing of these peaks underscores the importance of tailored, forward-looking policies to address challenges, such as population decline, population ageing, urbanization and resource demands, while also leveraging opportunities, such as more people of different age cohorts living and working together.
Fertility and mortality rates are declining, resulting in changing population age structures in Asia and the Pacific
Figure 3. Age and sex distribution of the total population in Asia and the Pacific, 1990, 2024 and 2050
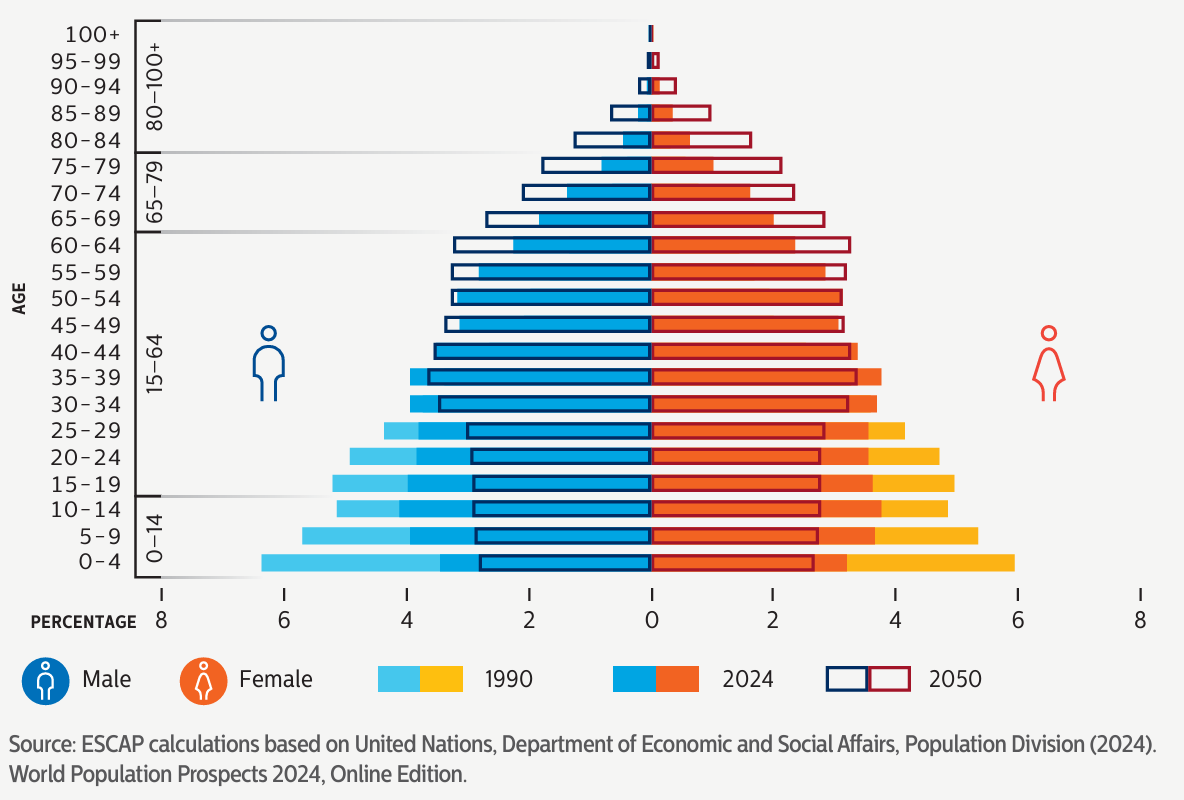
Population pyramids for Asia and the Pacific show profound changes in age structures across the region over time, reflecting declining mortality and fertility rates. In 1990, a broader base of younger age groups dominated, but by 2024, a noticeable narrowing of the base is evident, with further contraction projected to occur by 2050. Additionally, the pyramids highlight the increasing proportion of older age groups, particularly older women, indicative of their longer life expectancy. The shifting age structure reflects both the successes and challenges of socioeconomic development, underscoring the need for adaptive policies to address the challenges and opportunities of these demographic shifts.
Fertility rates are declining rapidly across Asia and the Pacific
Figure 4a. Proportion of population in countries in Asia and the Pacific (and number of countries) where total fertility rates are “less” or “equal or greater” than replacement level (2.1 live births per woman aged 15-49), 1990, 2024 and 2050
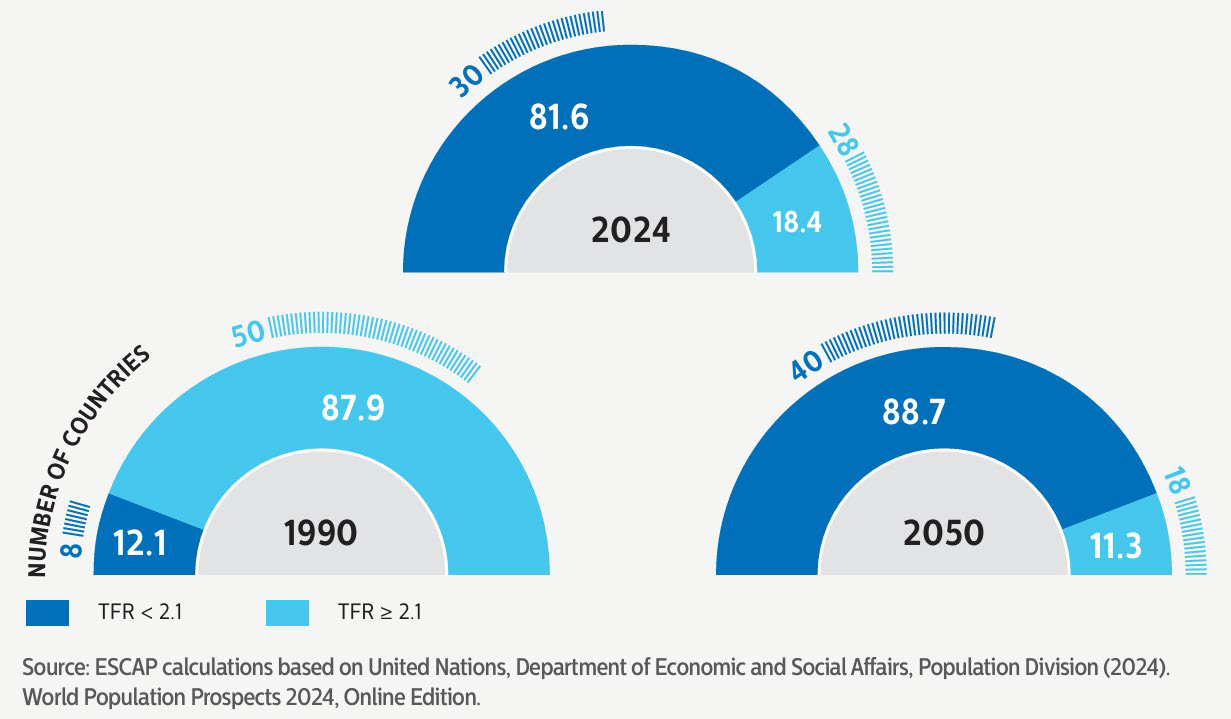
Fertility rates in Asia and the Pacific have been declining rapidly, with the majority of the population now living in countries where the total fertility rate (TFR) is below the replacement level of 2.1 live births per woman. In 1990, 12.1 per cent of the population in Asia and the Pacific lived in low-fertility countries, increasing to 81.6 per cent in 2024 and projected to reach 88.7 per cent by 2050. The number of countries with fertility rates at or above replacement level has decreased from 50 in 1990 to 28 in 2024, and it is projected to drop further to 18 by 2050. This demographic shift underscores the growing challenges of population ageing, reduced workforce sizes, greater care needs and the need for forward-looking and rights-based policies to adapt to these changes.
Fertility rates are declining across Asia and the Pacific
Figure 4b. Total fertility rates, live births per woman aged 15-49, by Asia-Pacific country/area and subregion, 1990, 2024 and 2050
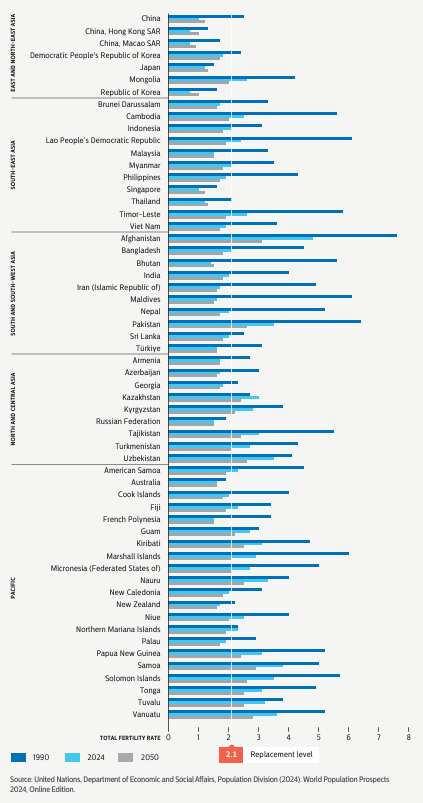
Fertility decline, combined with a decrease in mortality rates, has contributed to slowing population growth in the region. Most countries in Asia and the Pacific now have total fertility rates below 2.1 live births per woman, or replacement level fertility. The decline in fertility is influenced by several factors, including delayed age at marriage, increased use of family planning methods, migration from rural to urban areas, and the growing pursuit of education and employment by women. Yet, in several countries in the region, unmet need for family planning, including for modern methods, remains high; this must be addressed.
Life expectancy at birth in Asia and the Pacific is projected to increase, with women continuing to outlive men
Figure 5. Life expectancy at birth (LE), by Asia-Pacific country/area and subregion, 1990, 2024 and 2050
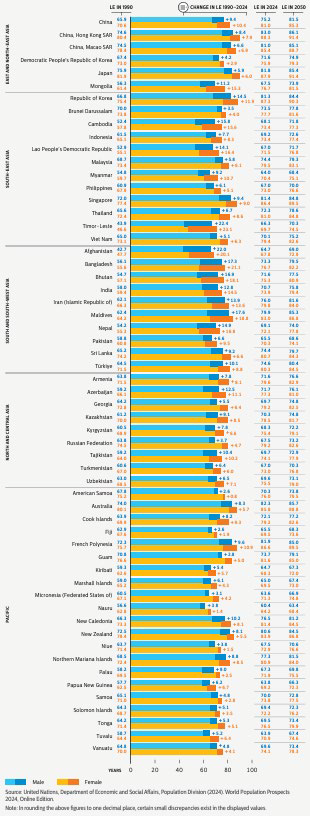
Life expectancy at birth in Asia and the Pacific has significantly improved, rising from 64.1 years in 1990 to 74.7 years in 2024; it is projected to increase to 79.2 by 2050. Women continue to outlive men by an average life expectancy of about 5 years — 77.4 years compared to 72.1 years, in 2024. However, this longevity advantage for women does not necessarily equate to additional years of good health, as women often spend about 5 more years in poor health compared to men, particularly in their later years. Disparities across subregions and countries highlight the need for health systems to prioritize not just life extension but also improved quality of life, especially as populations continue to age.
While the child (0-14) and youth (15-24) populations in Asia and the Pacific are growing slower and will eventually decline, the older population (65+) is growing and will continue to do so
Figure 6. Child, youth, working-age and older population in Asia and the Pacific, 1990, 2024 and 2050
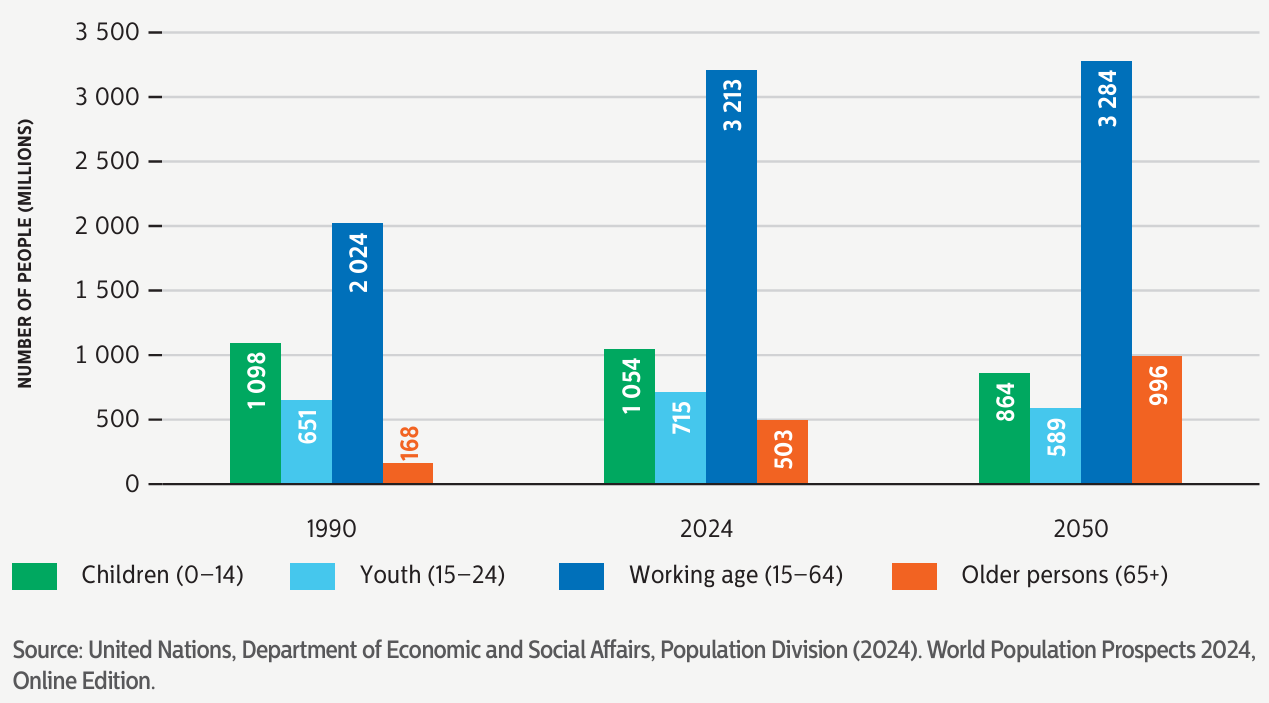
Population age structures are changing in Asia and the Pacific. While the size of the child (0–14) and youth (15–24) populations are projected to decline between 2024 and 2050, the working-age (15–64) population is projected to reach its peak in mid-2030 and then decline, while the older population (65+) is projected to continue to grow. Between 1990 and 2024, the number of older persons aged 65 years or over nearly tripled, from 168 million to 503 million, and it is projected to almost double again by 2050, reaching 996 million. This trend highlights a transition to older and more multigenerational societies, posing challenges and opportunities for countries to adapt policies on caregiving, pensions and workforce dynamics.
Population ageing is a megatrend in an increasing number of countries in Asia and the Pacific
Figure 7a. Proportion of population in countries in Asia and the Pacific (and number of countries) that are ageing, aged and super-aged societies, 1990, 2024 and 2050
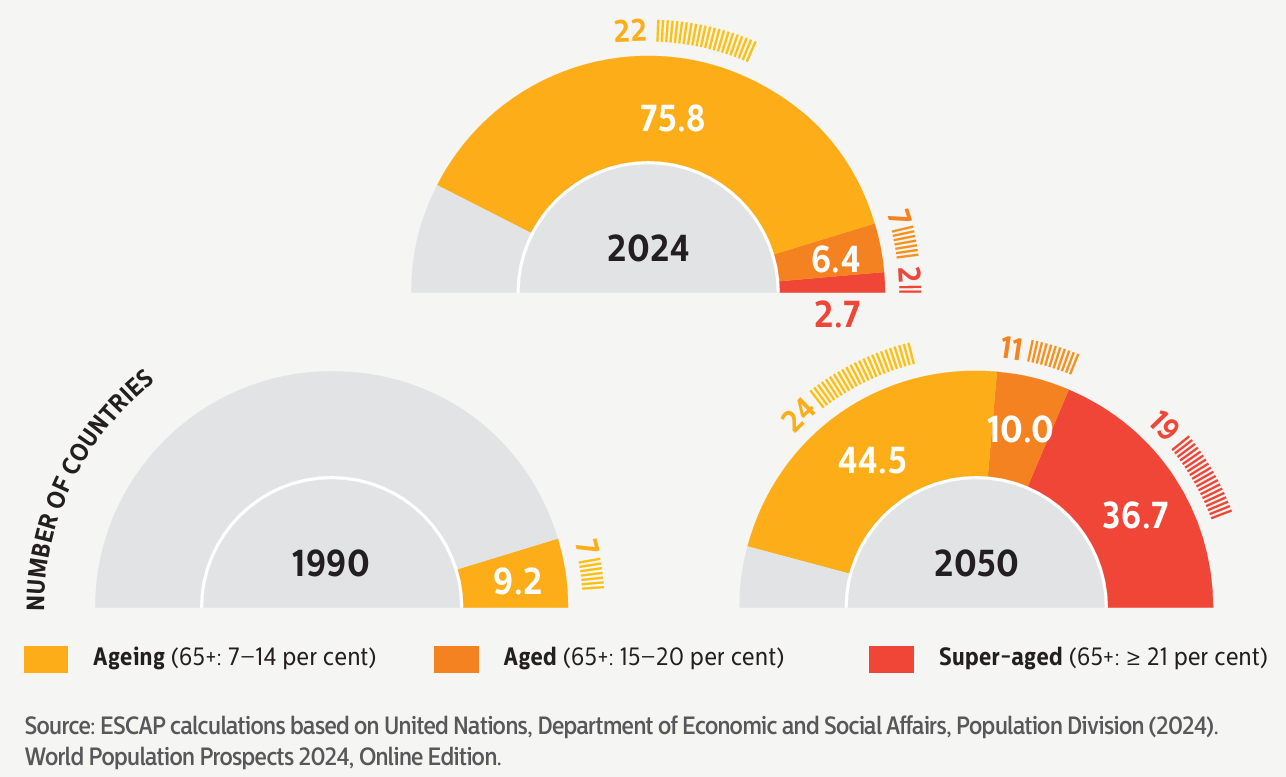
Population ageing has become a megatrend across Asia and the Pacific, with an increasing number of countries transitioning into “ageing,” “aged,” and “super-aged” societies. In 1990, only 9.2 per cent of the population (7 countries) lived in ageing societies (where 7–14 per cent of the population is aged 65+), with virtually no countries classified as aged or super-aged. By 2024, the situation has changed significantly, with 75.8 per cent of the population (22 countries) in ageing societies, 6.4 per cent (7 countries) in aged societies (15–20 per cent aged 65+), and 2.7 per cent (2 countries) in super-aged societies (equal or more than 21 per cent aged 65+). Looking ahead to 2050, projections show 44.5 per cent (24 countries) in ageing societies, 10.0 per cent (11 countries) in aged societies, and a remarkable 36.7 per cent (19 countries) in super-aged societies. This overall trend toward aged and super-aged societies across Asia and the Pacific underscores the need for people-centred policies over the life course that will prepare people for living longer and healthier lives.
Figure 7b: Number of people aged 65 years or over in Asia and the Pacific, and by subregion, 1950—2100
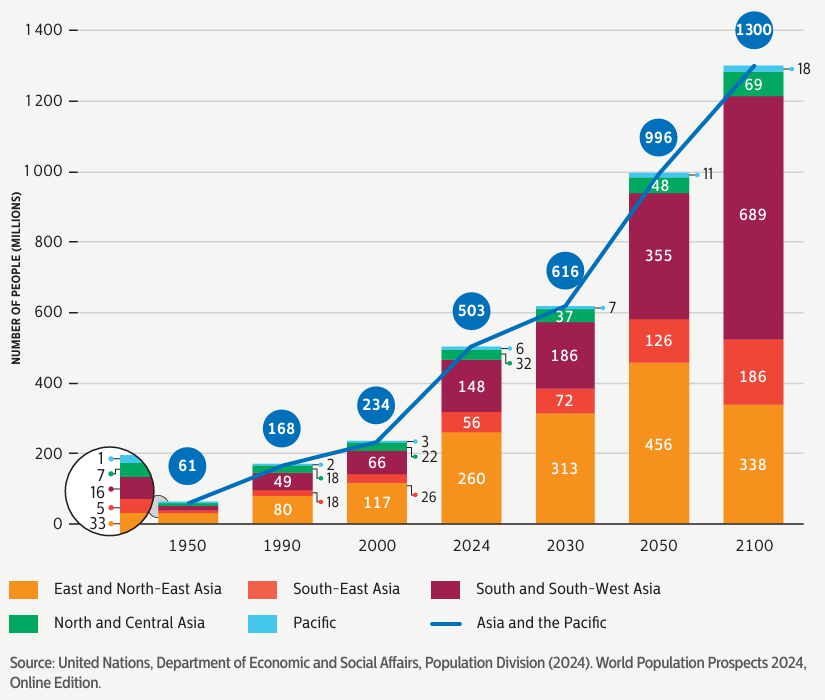
As Asian and Pacific countries have experienced the demographic transition, their age structures have changed. Resultantly, the number and share of older persons have increased. In 2024, the region is home to 503 million people aged 65 years or over, representing 10.5 per cent of the total population. By 2050, the number of older persons is projected to almost double to 996 million, representing 19.3 per cent of the total population. Population ageing has been particularly fast in Asia and the Pacific due to the rapid decline in fertility, calling on countries to take swift action to address challenges and opportunities associated with the aforementioned changes.
The oldest-old population (80+) is growing at an accelerated pace, albeit with variations in growth rates across Asia-Pacific subregions
Figure 8. Oldest-old population (80+) in Asia and the Pacific, and by subregion, 1990, 2024 and 2050 (in millions and as a percentage of older population 65+)
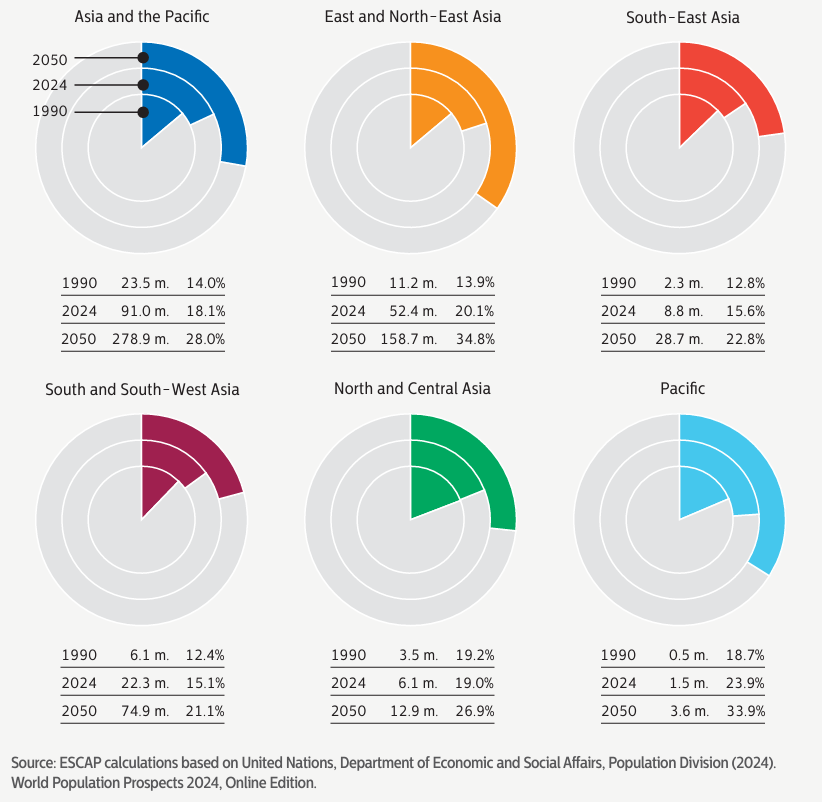
There has been a significant growth of the oldest-old population in Asia and the Pacific. In 2024, there are 91.0 million people aged 80 years or over, which represented 18.1 per cent of the older population (65+). It is projected that, by 2050, the number of oldest-old will be 278.9 million, or 28.0 per cent of the total population 65 years or over. There are disparities in growth rates of the oldest-old population across different subregions, indicating a need for nuanced and subregion-specific policy responses to support this rapidly expanding age group.
Most migration in Asia and the Pacific is regional in nature, with some migrants moving to other parts of the world
Figures 9. International migrant stock by countries of origin and destination, Asia-Pacific countries/areas and subregions, and other regions of the world, mid-2022
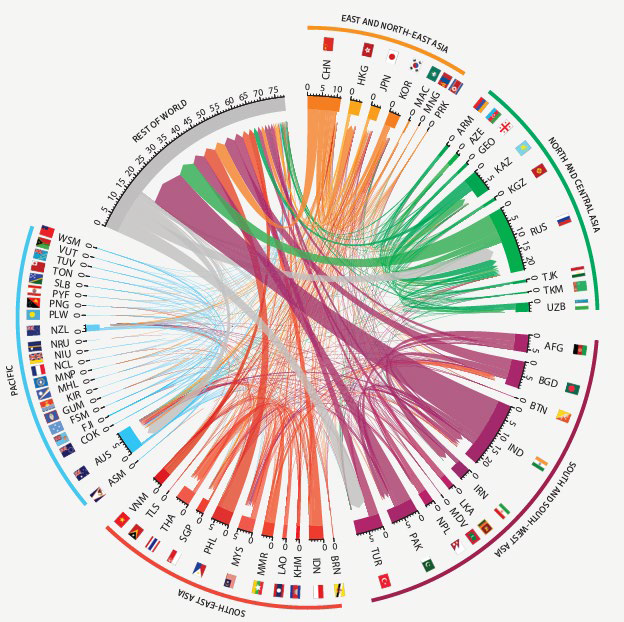
International migration in Asia and the Pacific is predominantly intra-regional, with most migrants moving within subregions or to neighbouring countries. A notable exception is the significant flow of male labour migration from South and South-West Asia to Western Asia, particularly to the Middle East. Several countries in the region (for example, Australia; Hong Kong, China; New Zealand; and the Russian Federation) are key destinations, while others primarily serve as countries of origin (for example, Bangladesh, China, India and the Philippines). Over time, some countries have become both countries of immigration and emigration. The management of migration in the region often involves bilateral memoranda of understanding to address labour migration needs and strengthen cooperation between origin and destination countries. The majority of people in the region migrate for work, but others are also driven by poverty, unsustainable development, discrimination, inequalities, conflicts, climate change, environmental degradation and disasters. When migration is safe, orderly and regular, with full respect and protection of the human rights of migrants and their families, migration can bring benefits to all.
Events
Check in Meeting with Focal Points on Ageing (South and South West Asia and North and Central Asia)
Check in Meeting with Focal Points on Ageing (East and North East Asia, Pacific and South East Asia)
Blogs and Op-eds

Building a future-ready society so people can live long and age well

Strengthening social health protection for health coverage for all ages